The Phase Field Analyzer
A research-grade desktop platform for real-time multi-sensor acquisition, 3D spatial fusion, software-defined radio, and AI-powered data analysis — all in one unified application.
One App.
Every Sensor.
Real-Time.
The Metatron Harmonic Phase Field Analyzer connects to an array of physical sensor pillars over USB serial, ingests data from three software-defined radio receivers, captures video from UVC cameras, measures radiation via Geiger counter audio-pulse counting, and displays everything in a unified, navigable desktop UI.
Built on Godot 4 (C#, .NET 6) with a custom binary packet protocol featuring CRC8 integrity checking, module IDENT handshaking, and automatic COM port scanning. Every sensor stream can be monitored live, logged to disk, replayed, and exported.
| UI runtime | Godot 4.4 (res://scenes/main.tscn) |
| Language | C# / .NET 6, nullable-enabled |
| Serial protocol | Binary packets · CRC8 · IDENT handshake |
| Audio capture | NAudio WaveInEvent, 44100 Hz mono 16-bit |
| Computer vision | OpenCvSharp4 + Windows Media Foundation |
| DSP / ML | MathNet.Numerics + MKL + Microsoft.ML |
| RF | RTL-SDR · librtlsdr · SDR# feature-set in C# |
| AI integration | OpenAI + Claude APIs via Metatron Data page |
| Logging | Serilog · rotating files · binary packet archive |
See It Running
Real screenshots from the live application — not mockups.
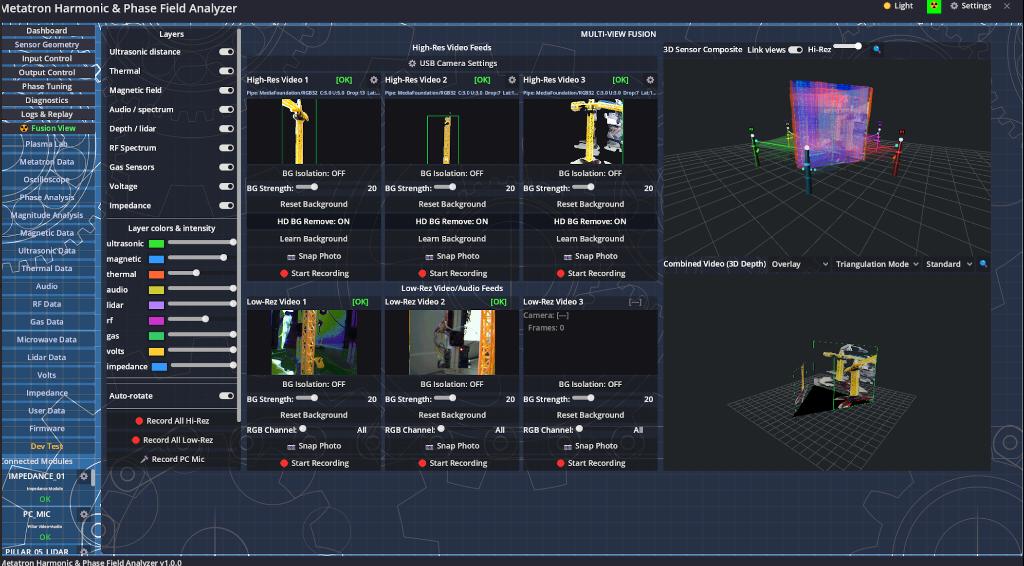
Multi-View Fusion with 3D Sensor Composite, 6× UVC camera feeds (Hi-Res + Lo-Rez), layer toggles, and real-time 3D point cloud overlay.
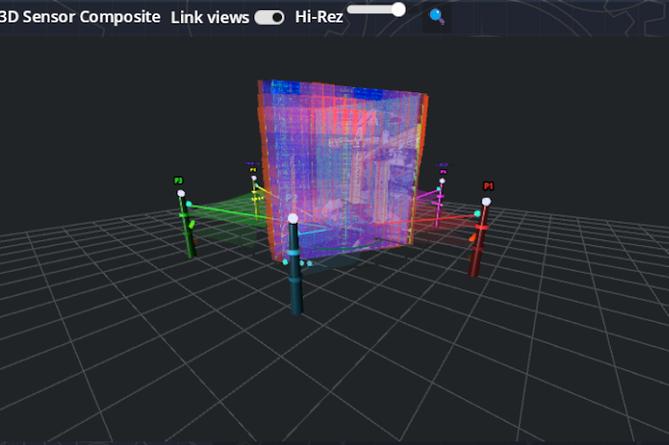
Six pillars rendered in world-frame 3D. LiDAR sweep data, IMU orientation, and camera feeds fused into a single navigable scene.
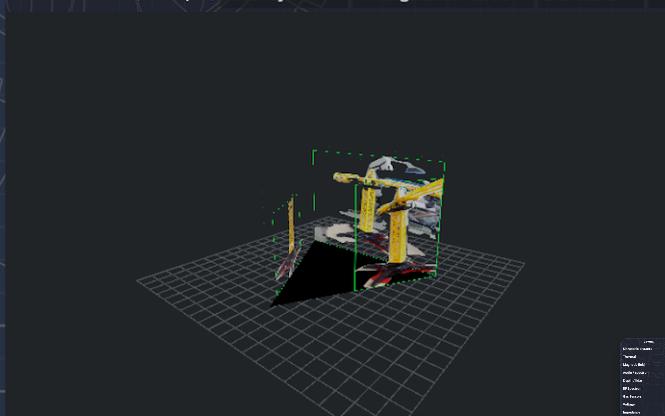
Real-time 3D reconstruction from multi-pillar LiDAR + IMU data. Triangulation mode with depth-composite overlay.
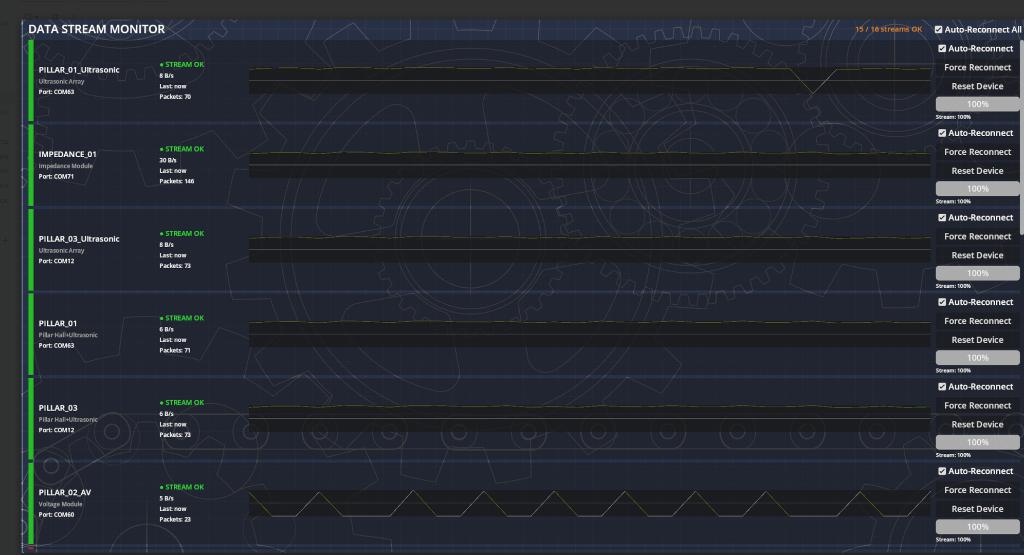
15/16 streams OK. Per-module COM port, bytes/sec, packet count, live waveform strip, auto-reconnect, force-reconnect, and reset controls.
25+ Dedicated UI Pages
Every sensor modality, instrument, and analysis tool has its own full-screen page. No cramped dashboards — each view is purpose-built.
AI-Powered
Data Analysis
The Metatron Data page connects directly to OpenAI and Anthropic Claude APIs. Add your API key in the settings panel and the application can analyze live sensor streams, interpret anomalies, and generate natural-language reports from raw multi-sensor data.
The AI receives the full normalized MTD data context — magnetic flux, LiDAR point clouds, thermal gradients, impedance sweeps, RF spectrum, and radiation counts — and can reason across all modalities simultaneously.
The Metatron Framework
ALT Phase Algorithm
The proprietary ALT Phase Algorithm computes phase coherence, magnitude relationships, and cross-sensor correlation in real time — normalizing outputs to Metatron Units so that magnetic flux, ultrasonic amplitude, LiDAR distance, thermal gradient, impedance phase angle, and RF power can all be plotted on the same scale and compared directly.
The Phase Singularity at (0,0) — where amplitude collapses to zero and phase becomes undefined — is not a problem to be filtered out. It is the most important feature in any signal. The topological interface between observable and hidden information domains.
- →Cross-domain phase coherence measurement
- →Magnitude normalization to MTD scale
- →Real-time multi-channel correlation matrix
- →Phase tuning exposed in Phase Tuning page
Metatron Units (MTD)
MTD is the common unit of measure produced by the normalization pipeline. Raw sensor readings — from Hall sensors, LiDAR, impedance sweeps, radiation CPM, RF power dBm — are all scaled to MTD via domain-specific calibration matrices, enabling the Fusion View to overlay heterogeneous data meaningfully.
The Central Equation
Six Pillar Modules
Each pillar has two sides (A and B), each running its own Arduino and firmware module. All communicate via the binary packet protocol.
Hall + Ultrasonic
- →Magnetic flux density mapping
- →Ultrasonic time-of-flight distance
- →Real-time 2D/3D field visualization
- →Acoustic proximity alerts
Video + Audio
- →Live UVC camera feed (OpenCvSharp4)
- →Real-time audio frequency analysis
- →Acoustic event timestamping
- →Video frame export & recording
Thermal + Gas
- →Non-contact IR temperature mapping
- →Multi-gas VOC concentration logging
- →Thermal anomaly detection
- →3D thermal surface interpolation
LiDAR + IMU
- →VL53L5CX ToF swept 0–90°
- →BNO08x 9-DoF IMU fusion
- →Madgwick quaternion filter
- →World-frame 3D point cloud
Beyond the Pillars
Additional instruments connect directly to the PC — SDR receivers, oscilloscope, Geiger counter, and camera array — all integrated into the same UI.
Voltage Monitor Pods ×2
ADS1115 16-bit ADC, 4-channel voltage monitoring of supply rails and coil drive voltages.
Impedance Analyzers ×2
AD5933 network analyzer, 1 kHz–100 kHz sweep. Magnitude, phase, and Nyquist plot.
Geiger Counter
Audio-pulse counting via PC mic-in. Live CPM, µSv/h conversion, configurable tube factors.
USB Oscilloscope
Multi-channel waveform capture. Time-domain and FFT frequency-domain views.
RTL-SDR Receivers ×3
Three independent RF receivers. FFT waterfall, demodulation (NFM/WFM/AM/USB/LSB/CW).
UVC Camera Array
Hi-res + lo-res UVC cameras via Windows Media Foundation. CV analysis and recording.
Data Stream
Monitor
Every connected module is tracked in real time. The Data Stream Monitor shows COM port assignment, bytes/sec throughput, packet count, and a live waveform strip for each stream.
Open Source.
MIT Licensed.
Everything on GitHub.
Clone the repo, connect your pillars, and start acquiring data. Full build instructions, firmware, schematics, and BOM are all included.